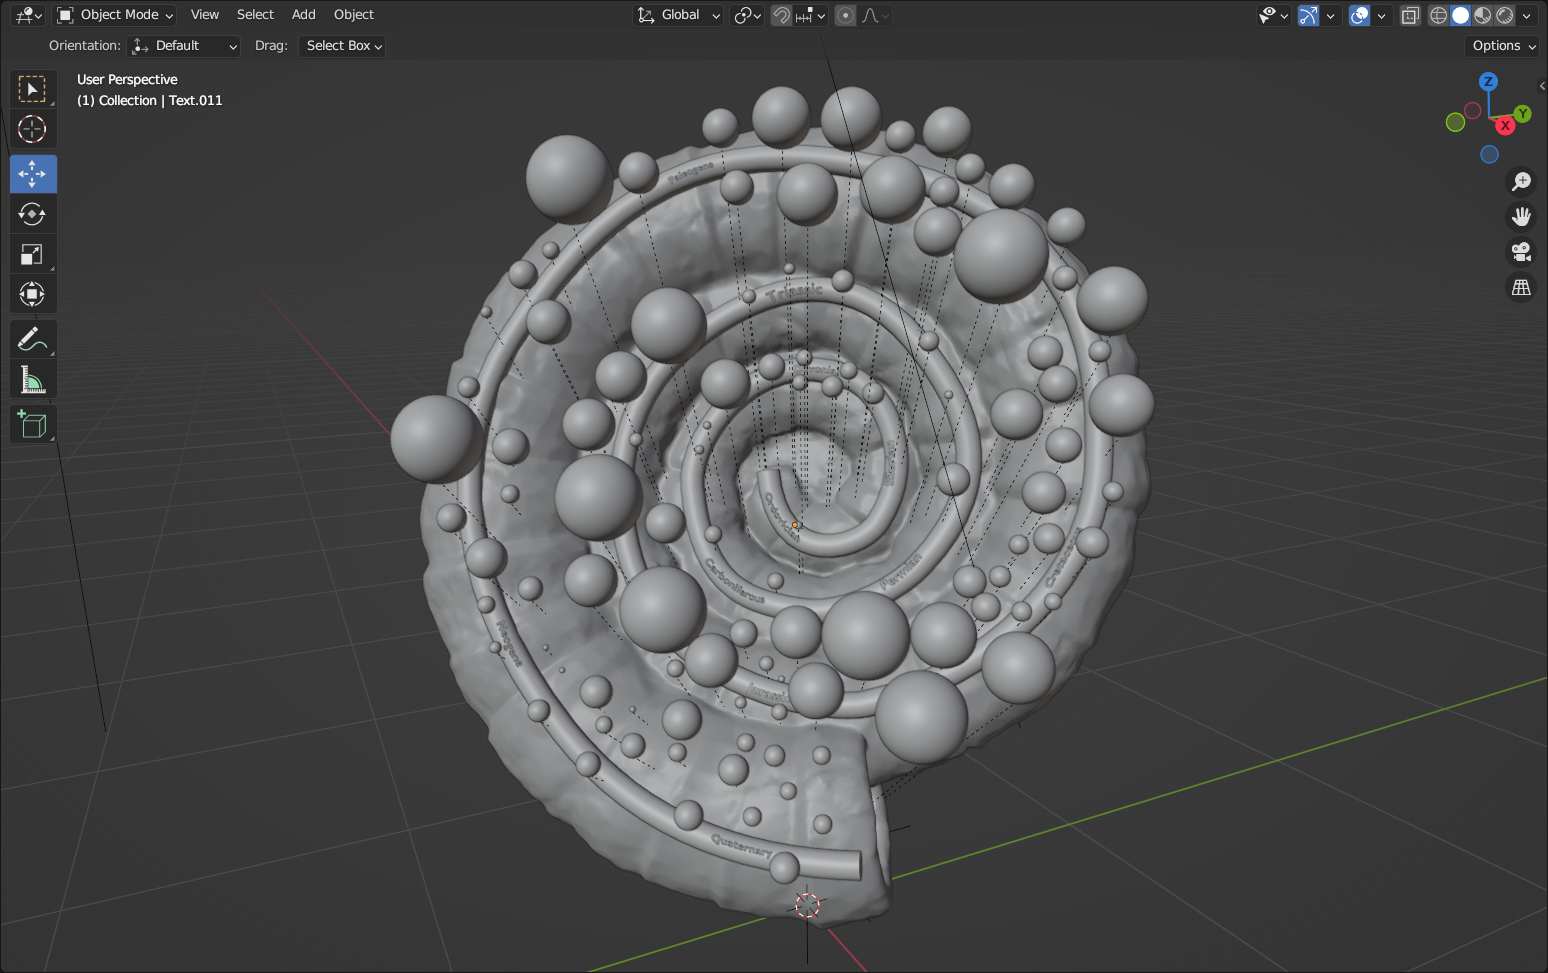
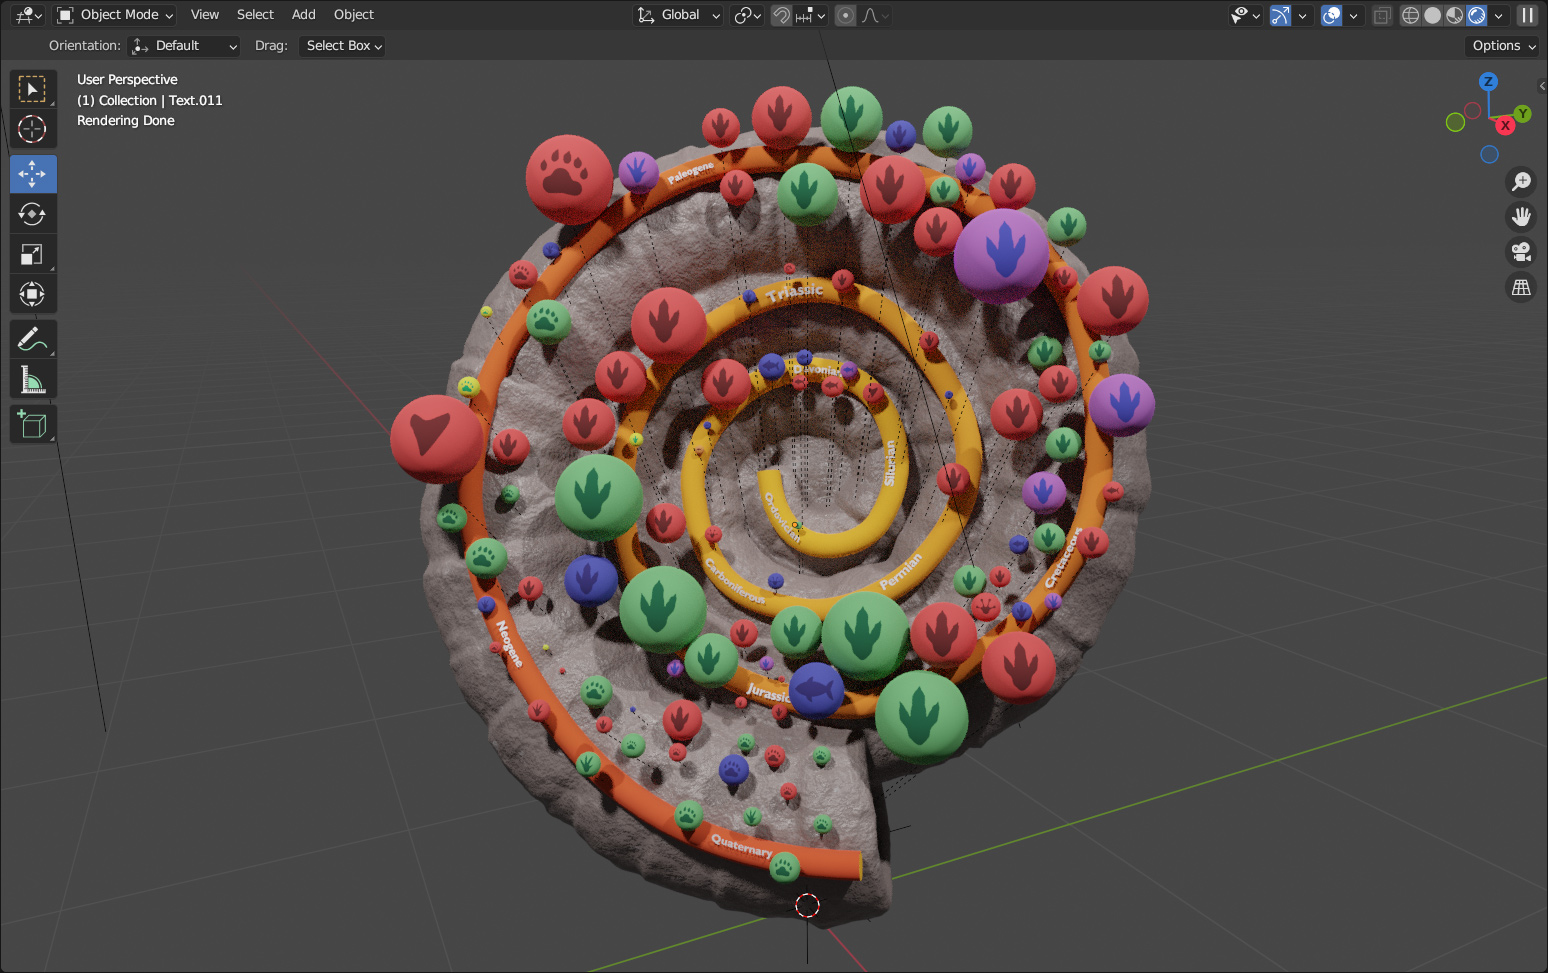
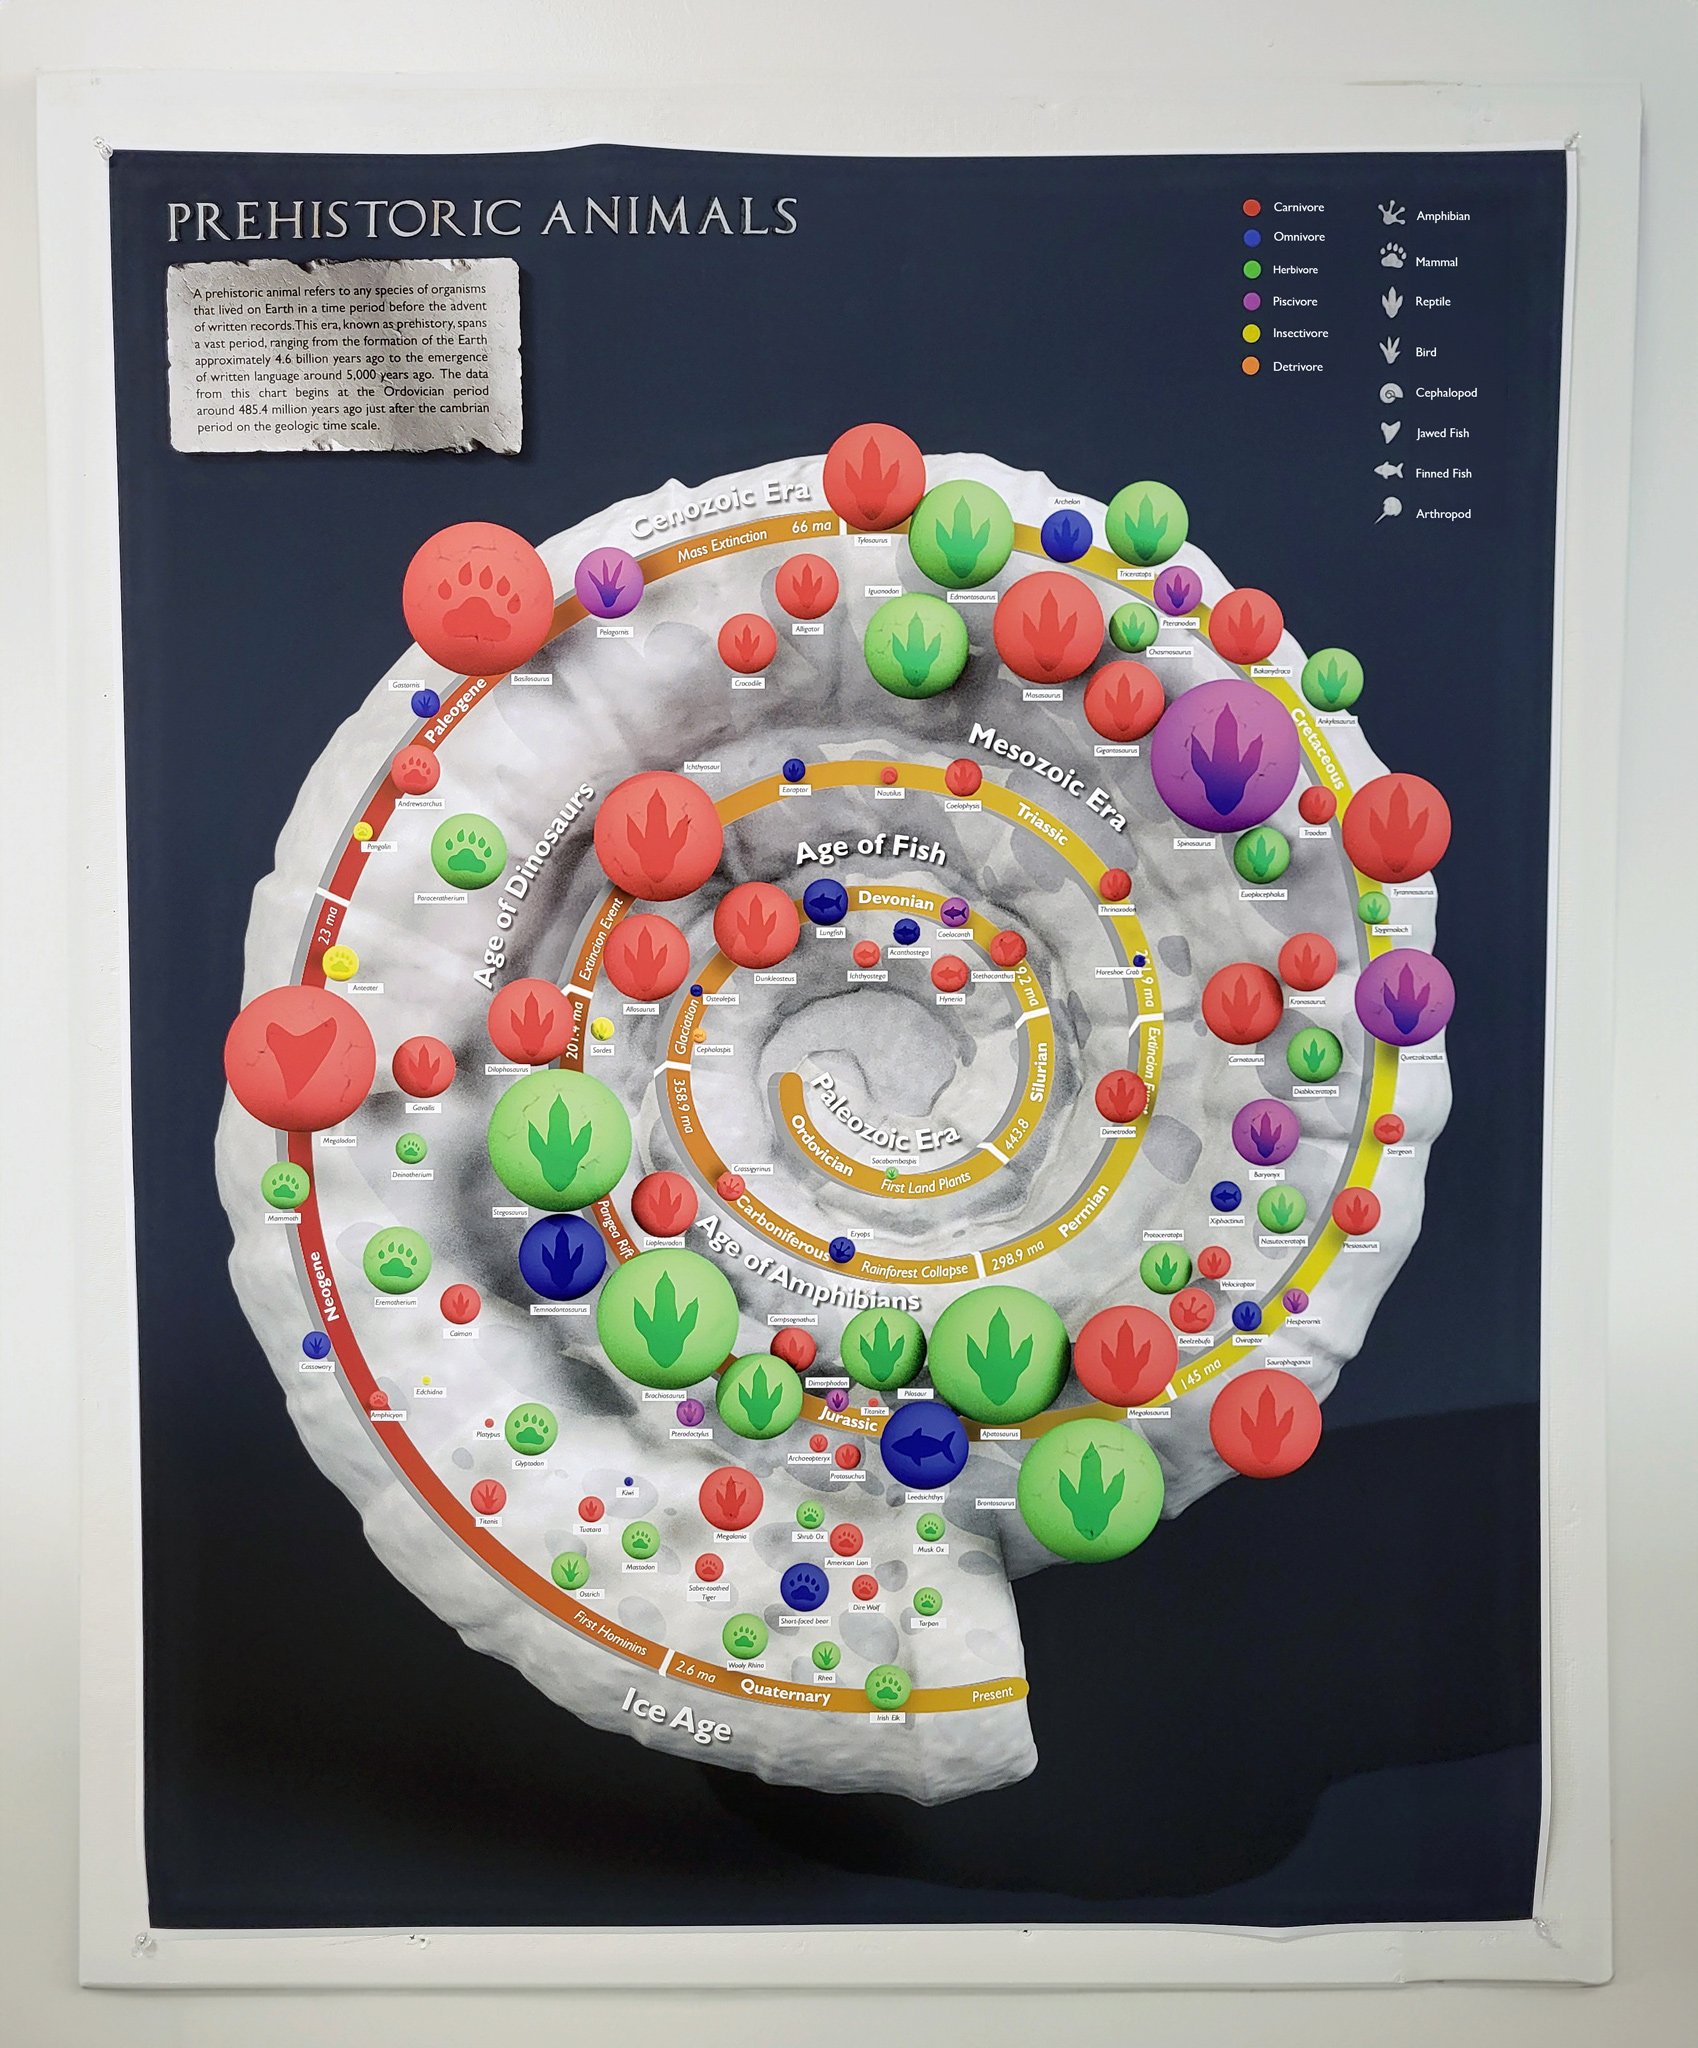
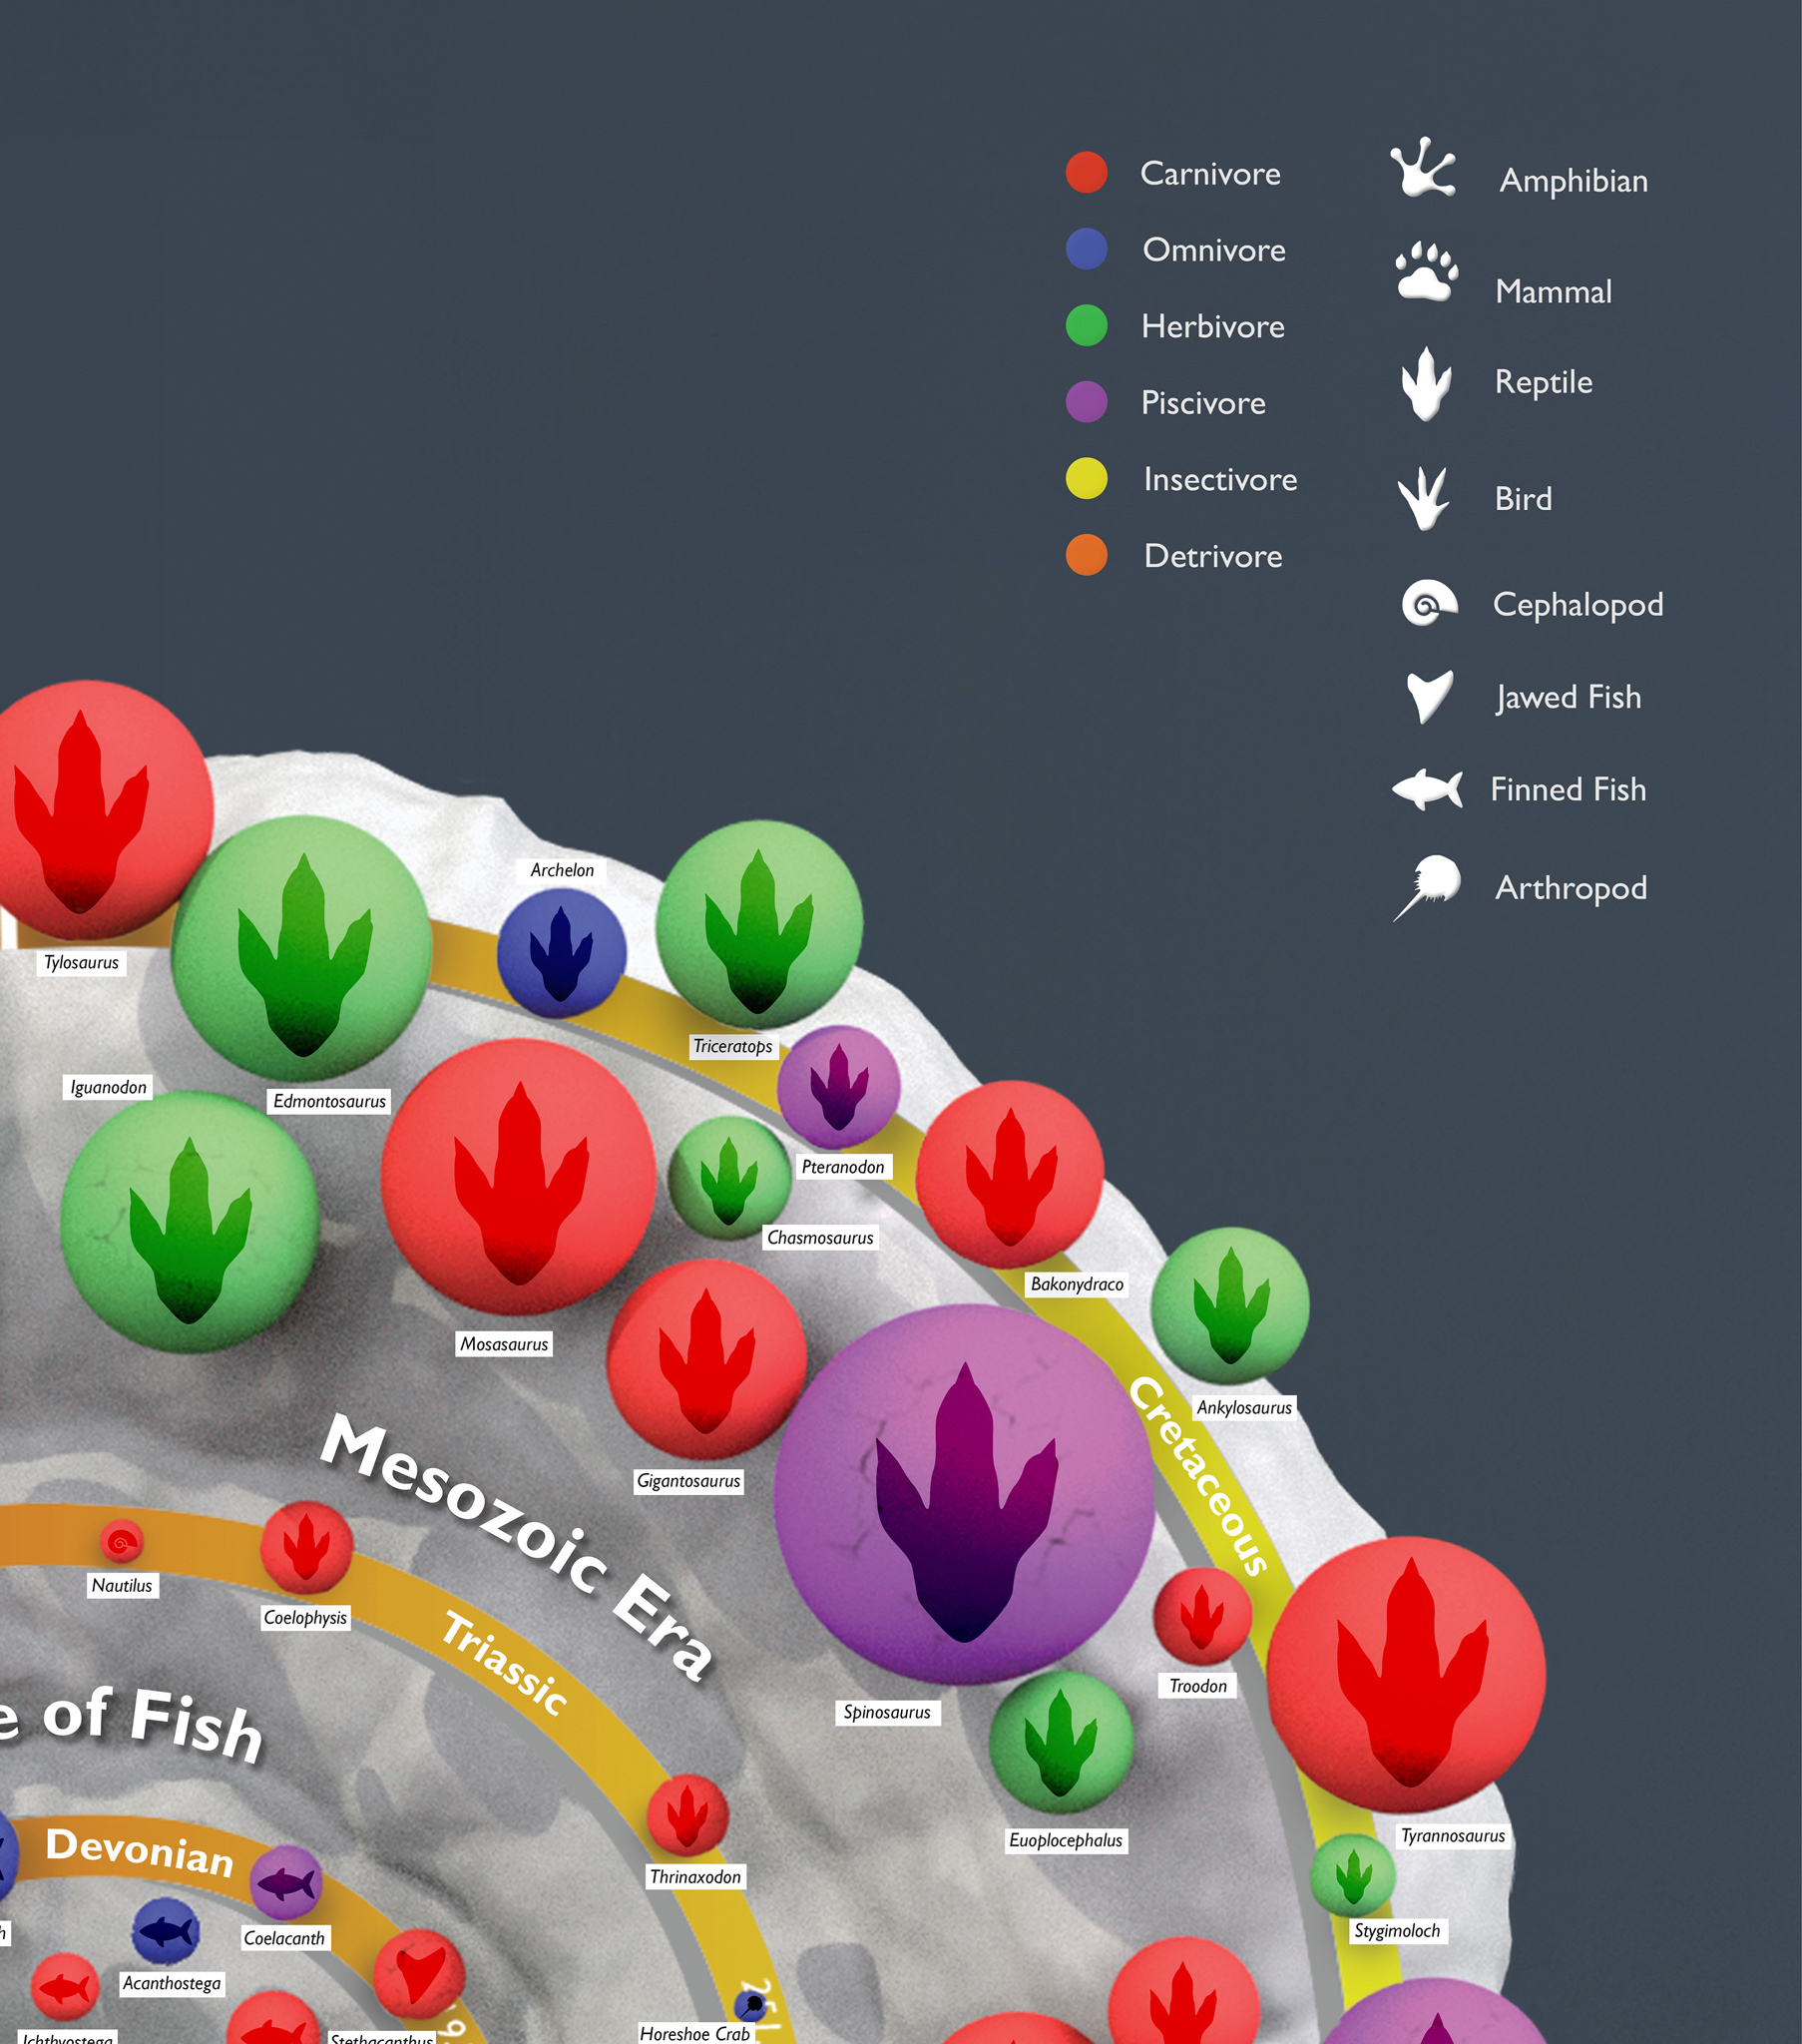
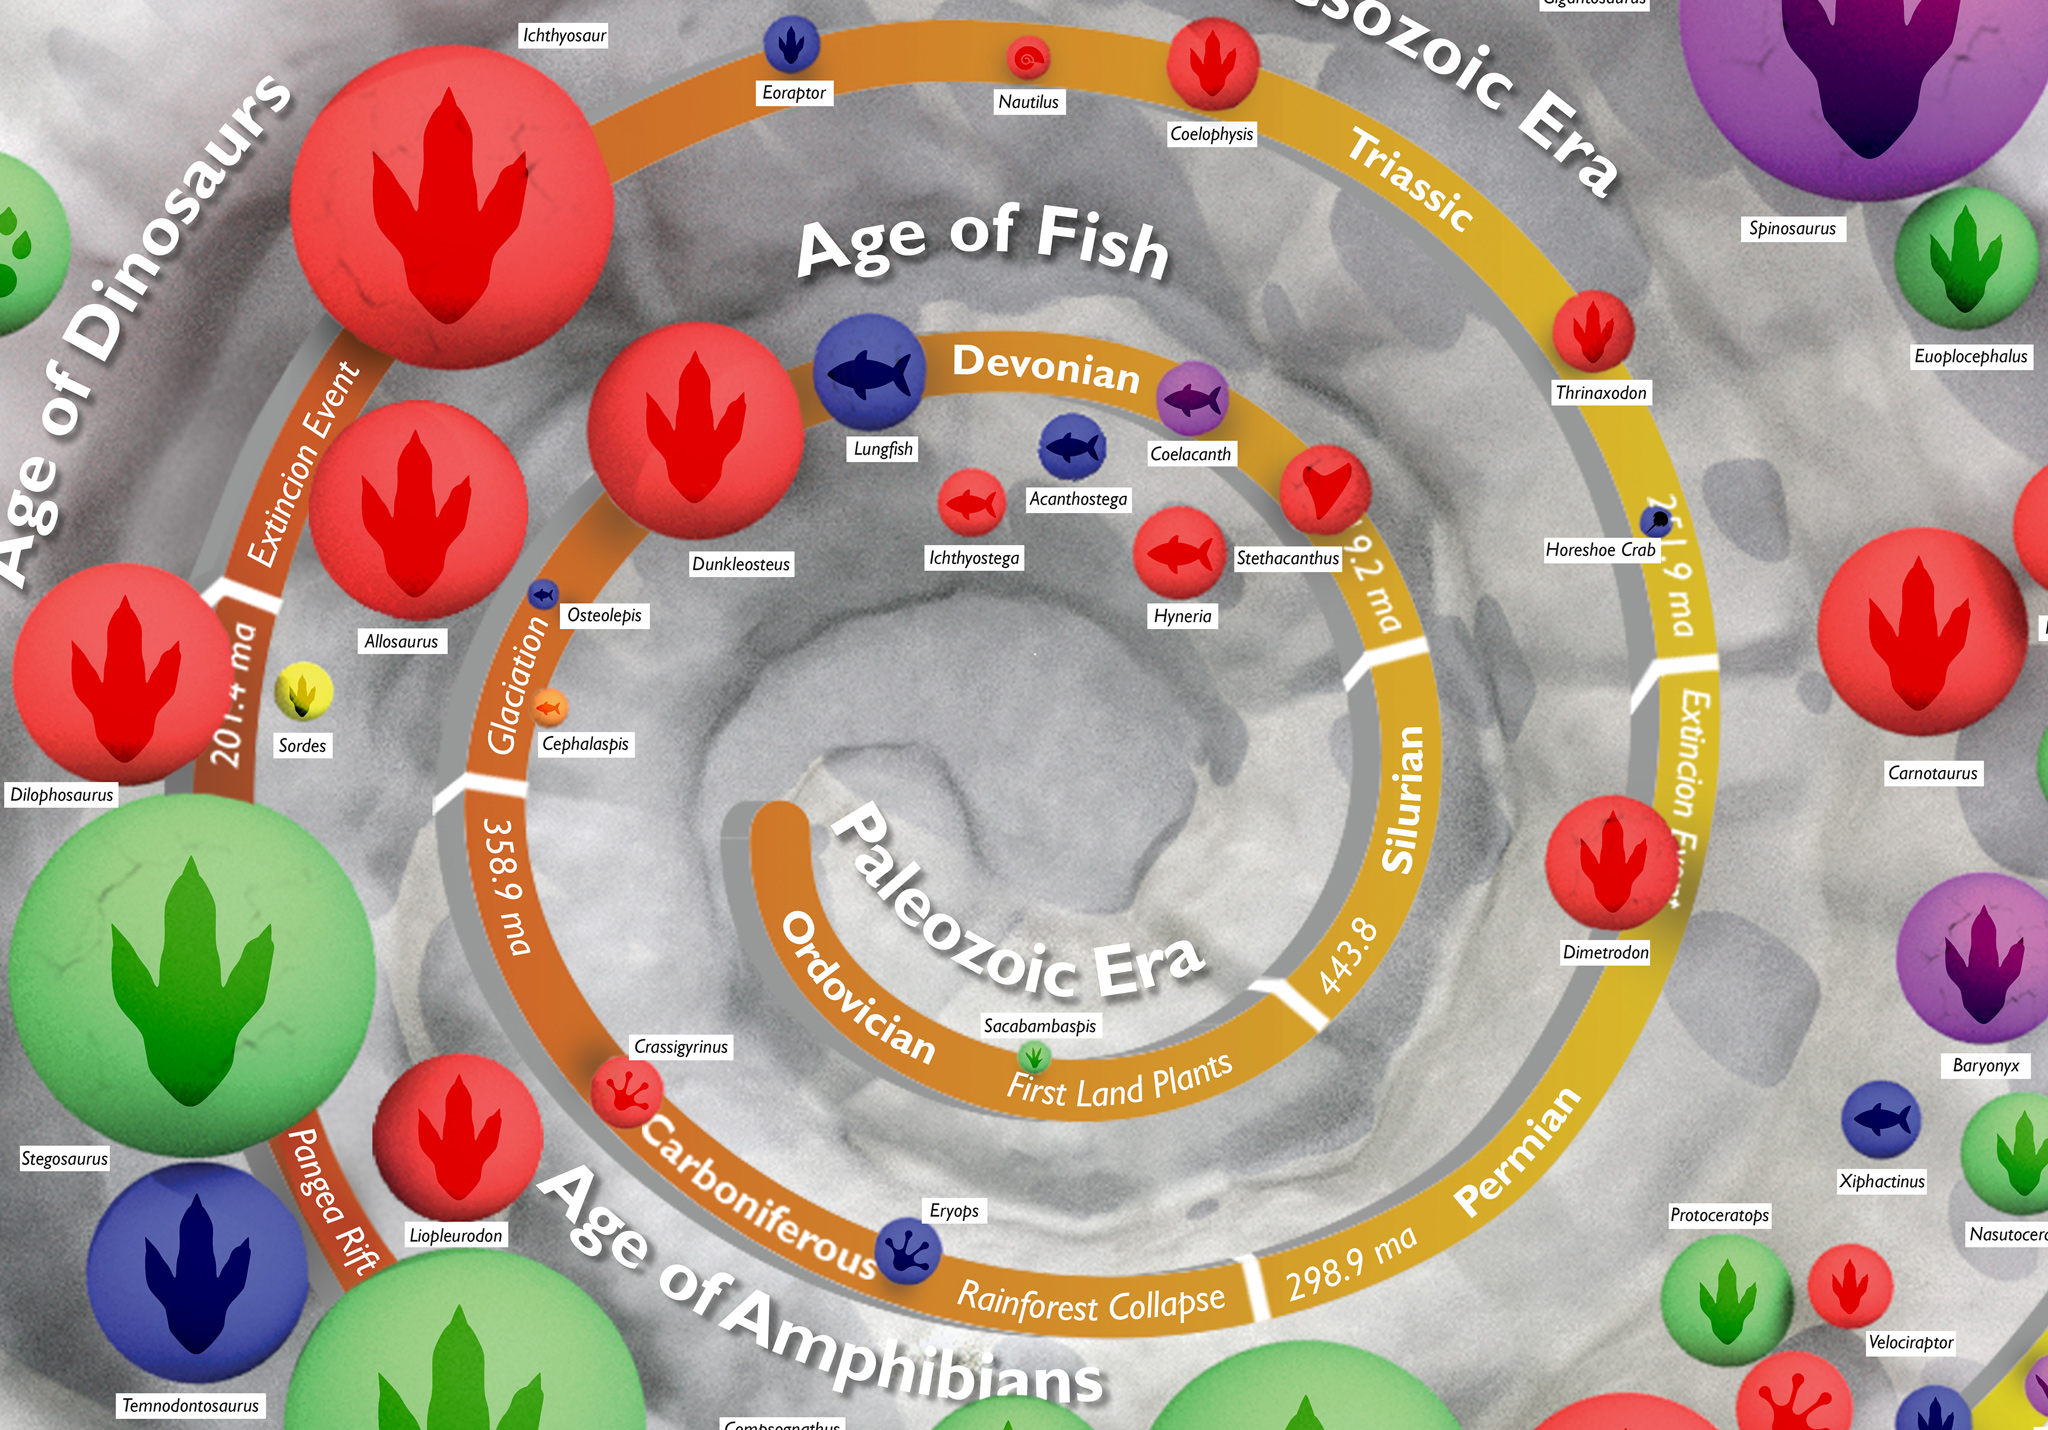
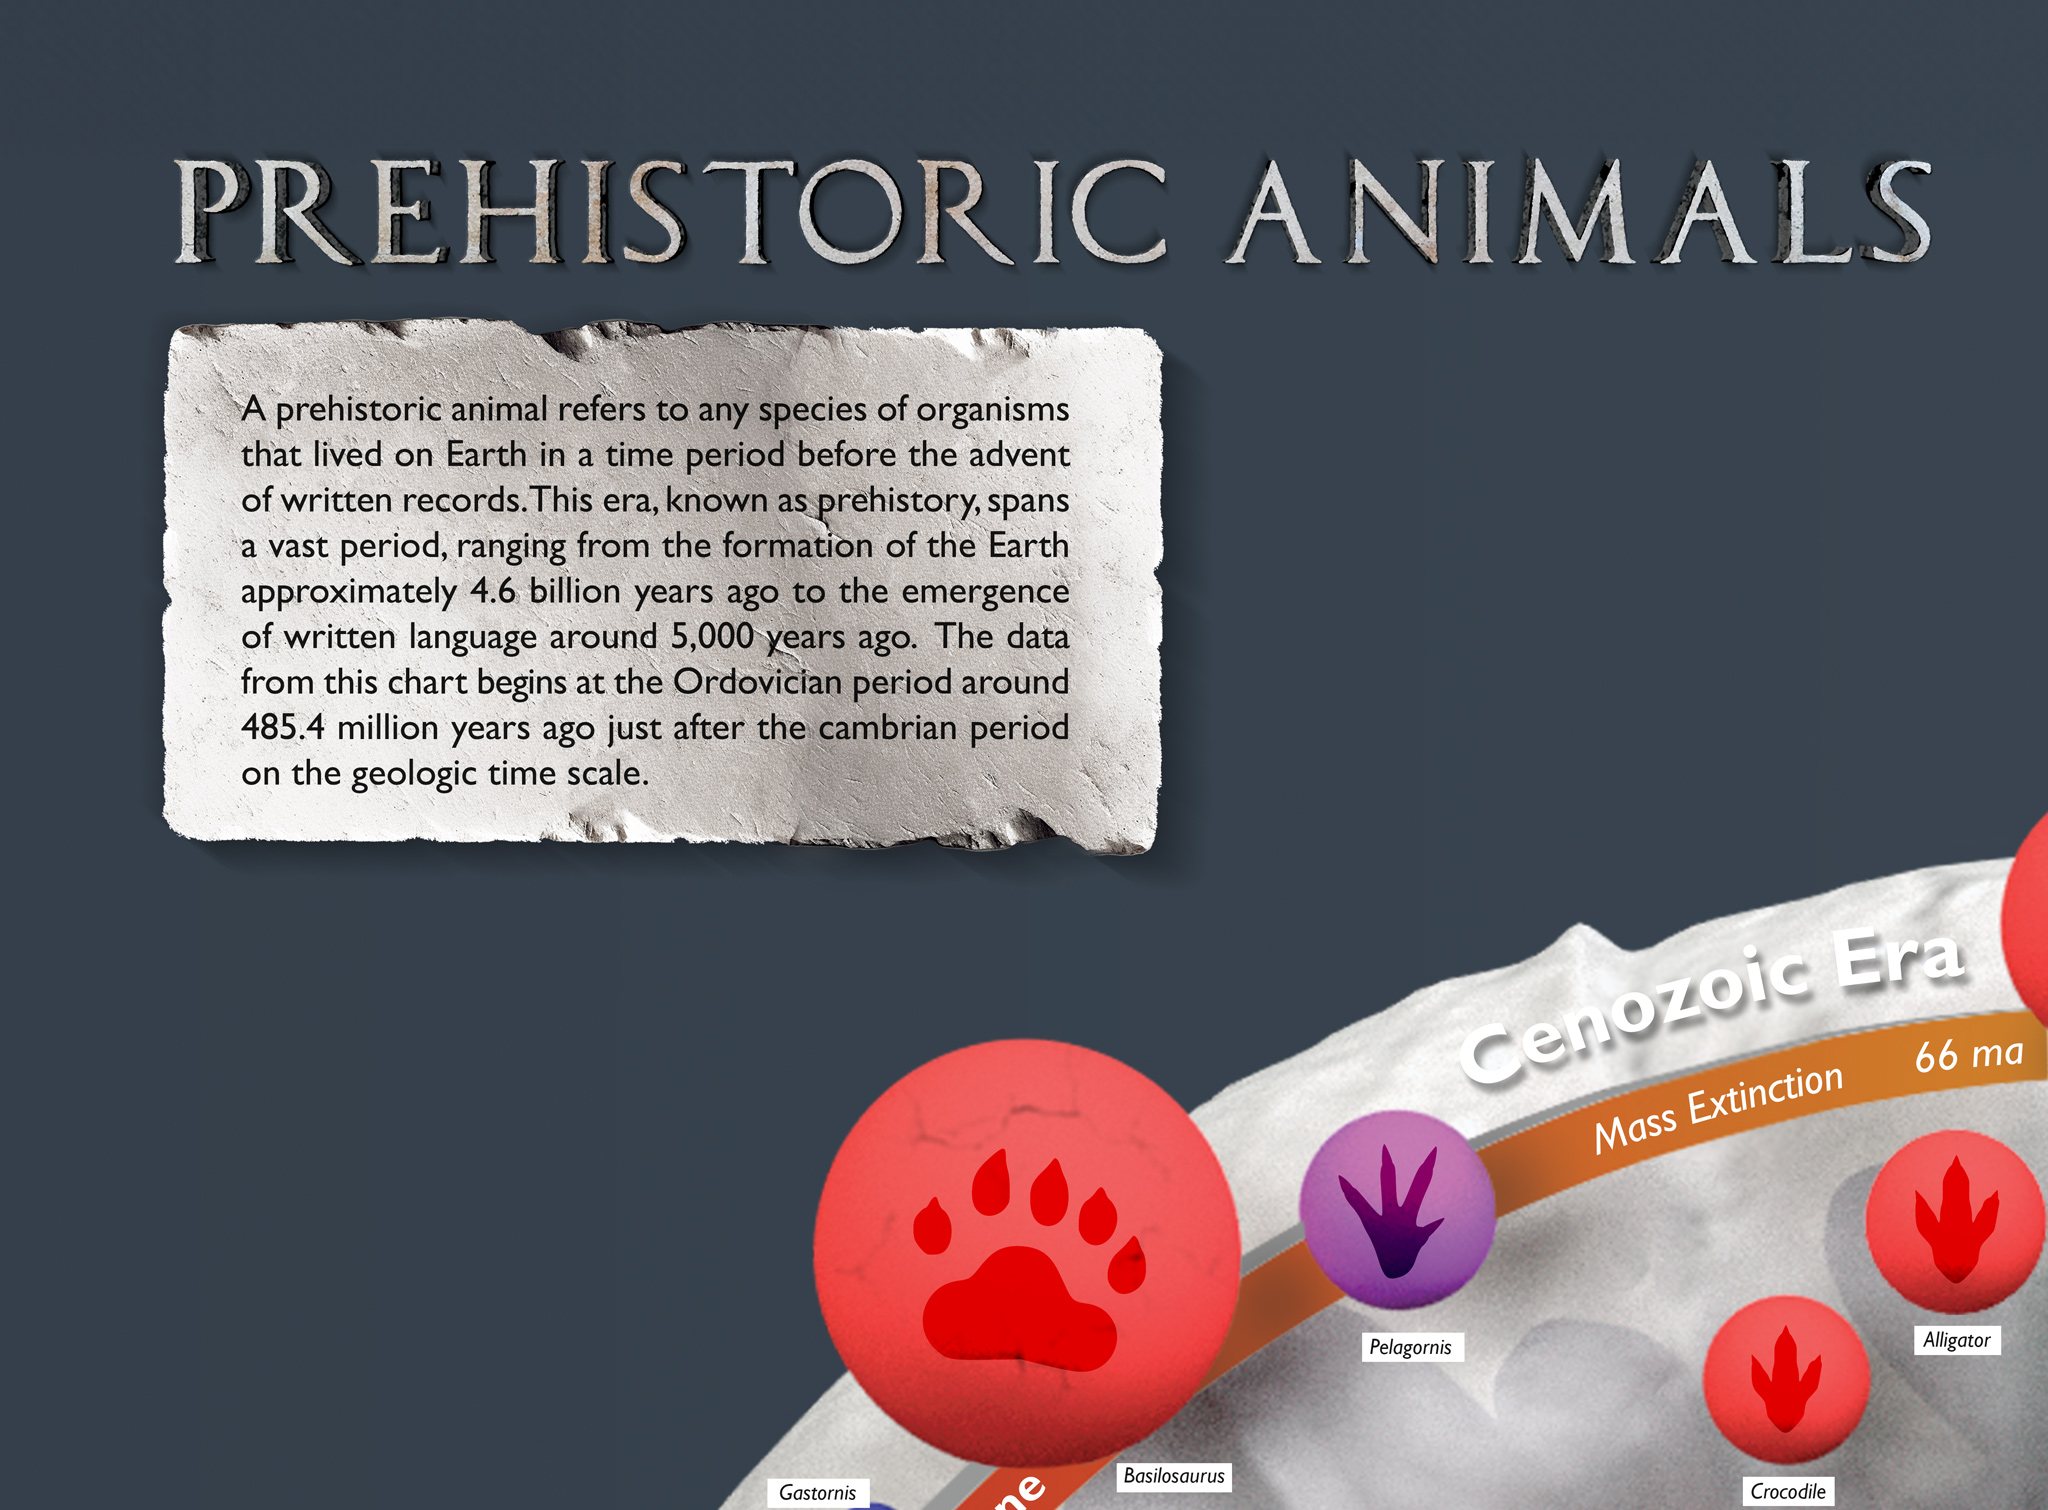
This project was a data visualization poster for 100 prehistoric animals form different time periods categorized by class, diet, size, and age. The key indicates the meaning for the icons and colors. The design features a bubble chart and a time line that spirals towards the design's center. The fossil and data points were created using 3D software.
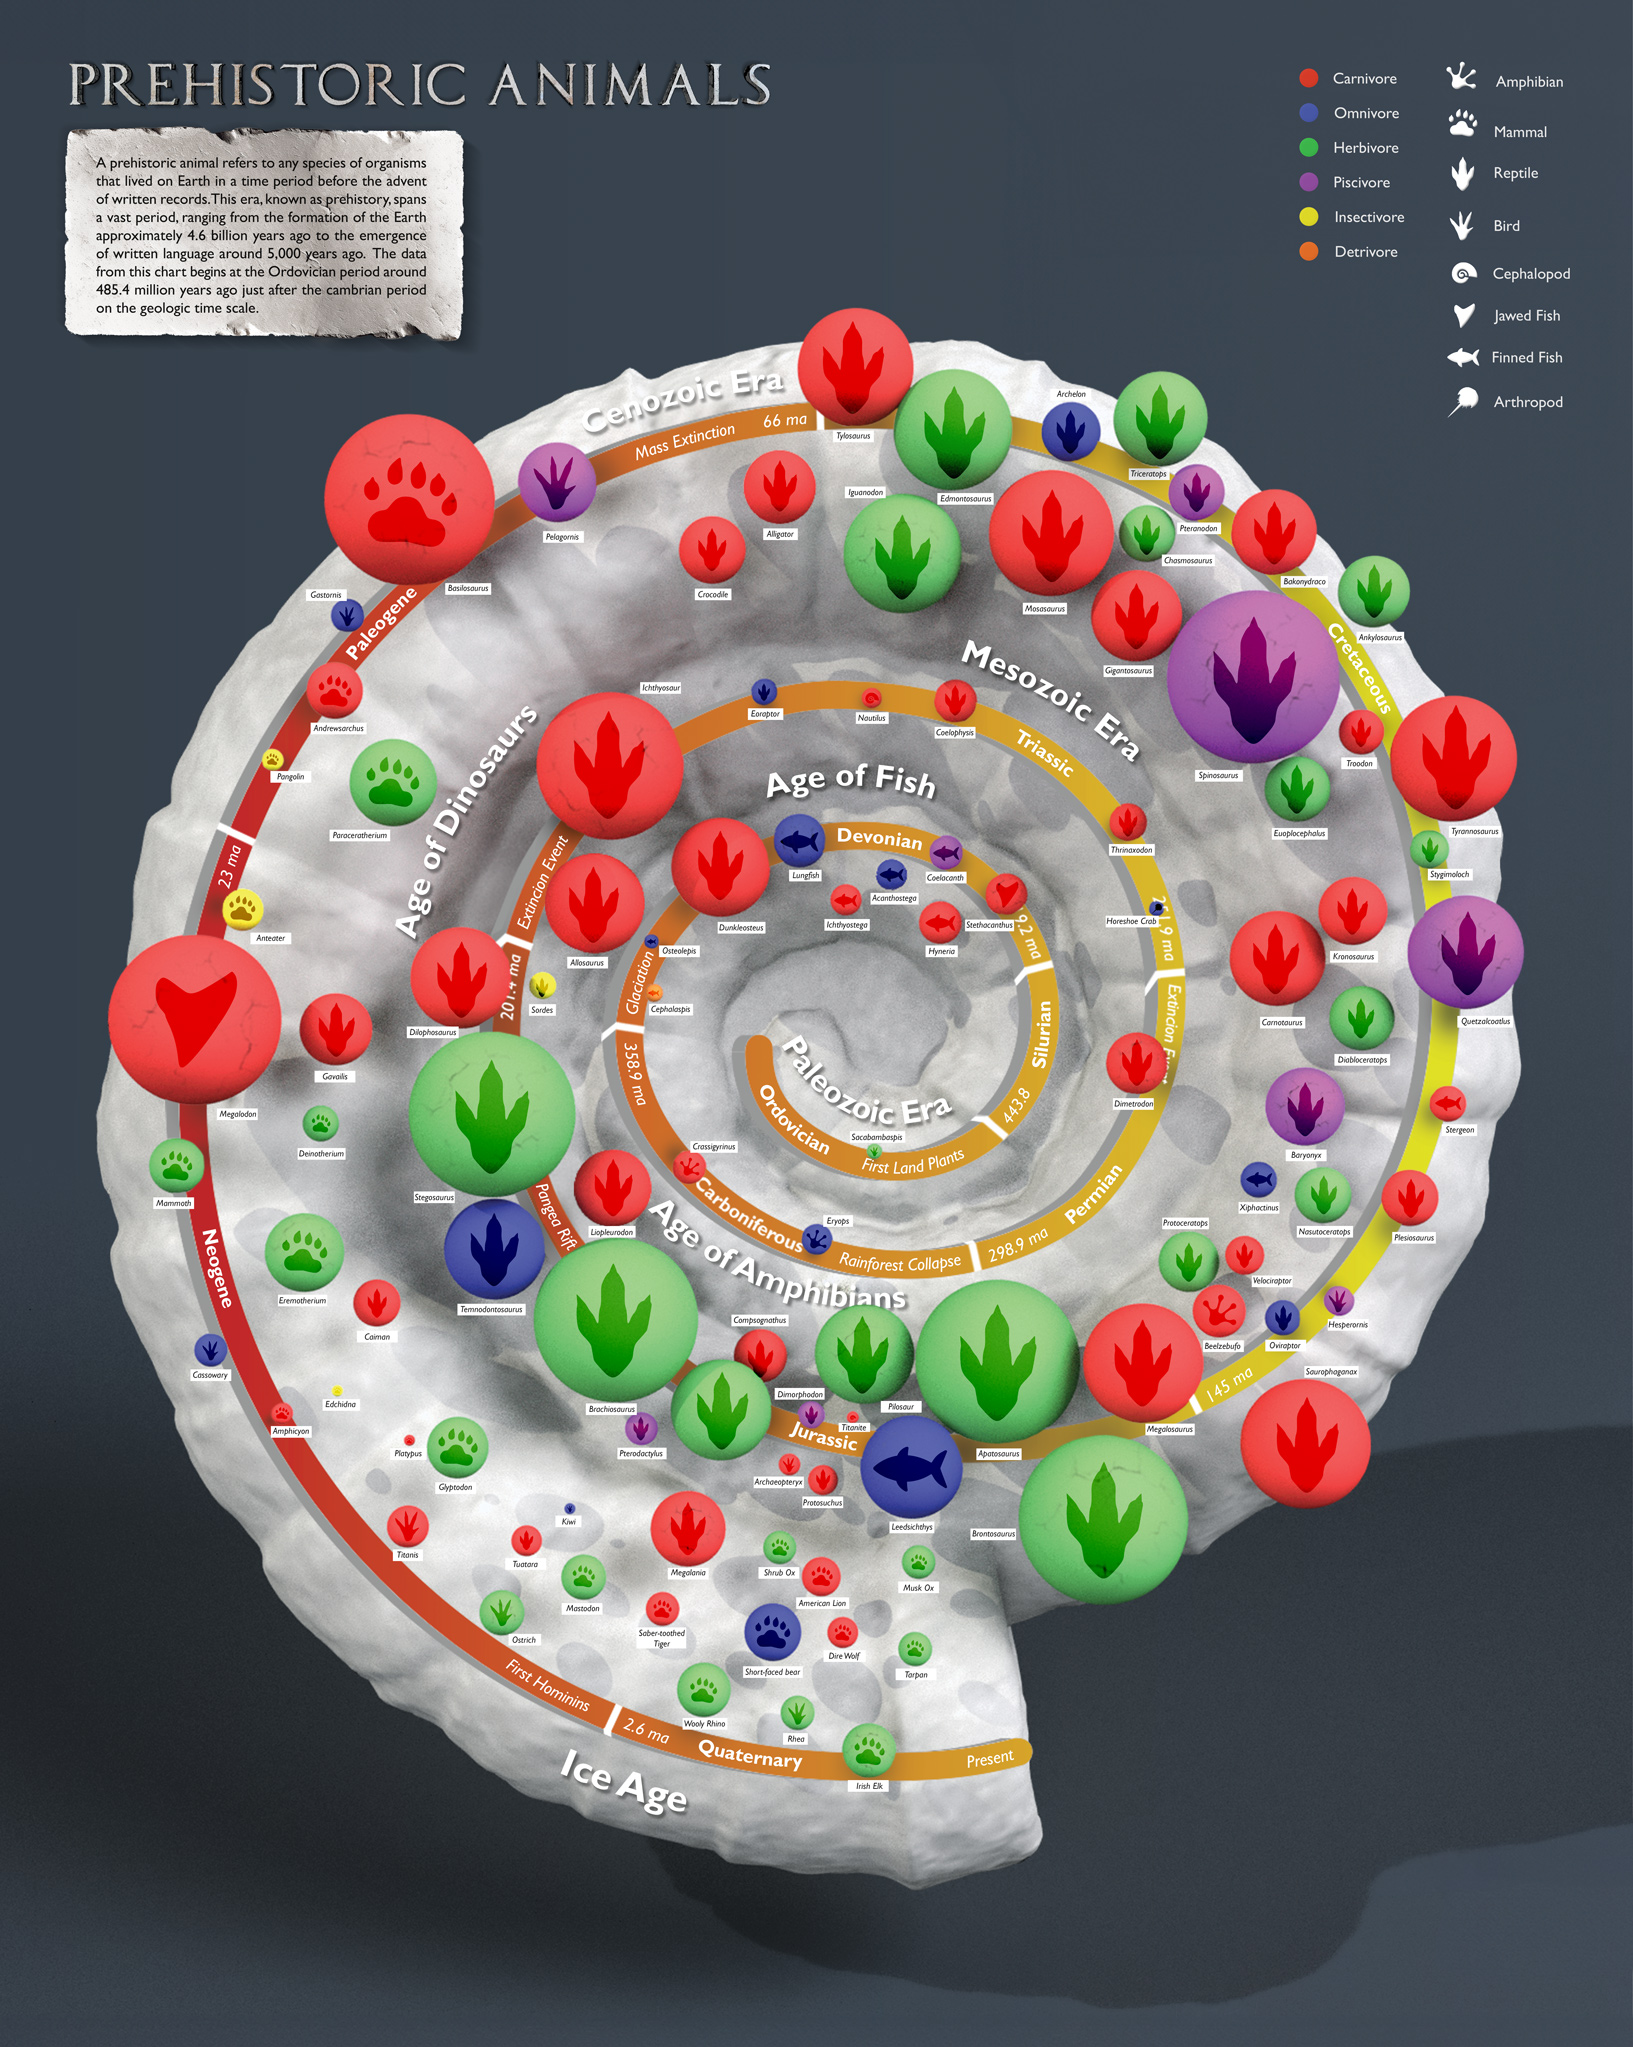
Dimensions: 36x45 in
Medium: Digital Print
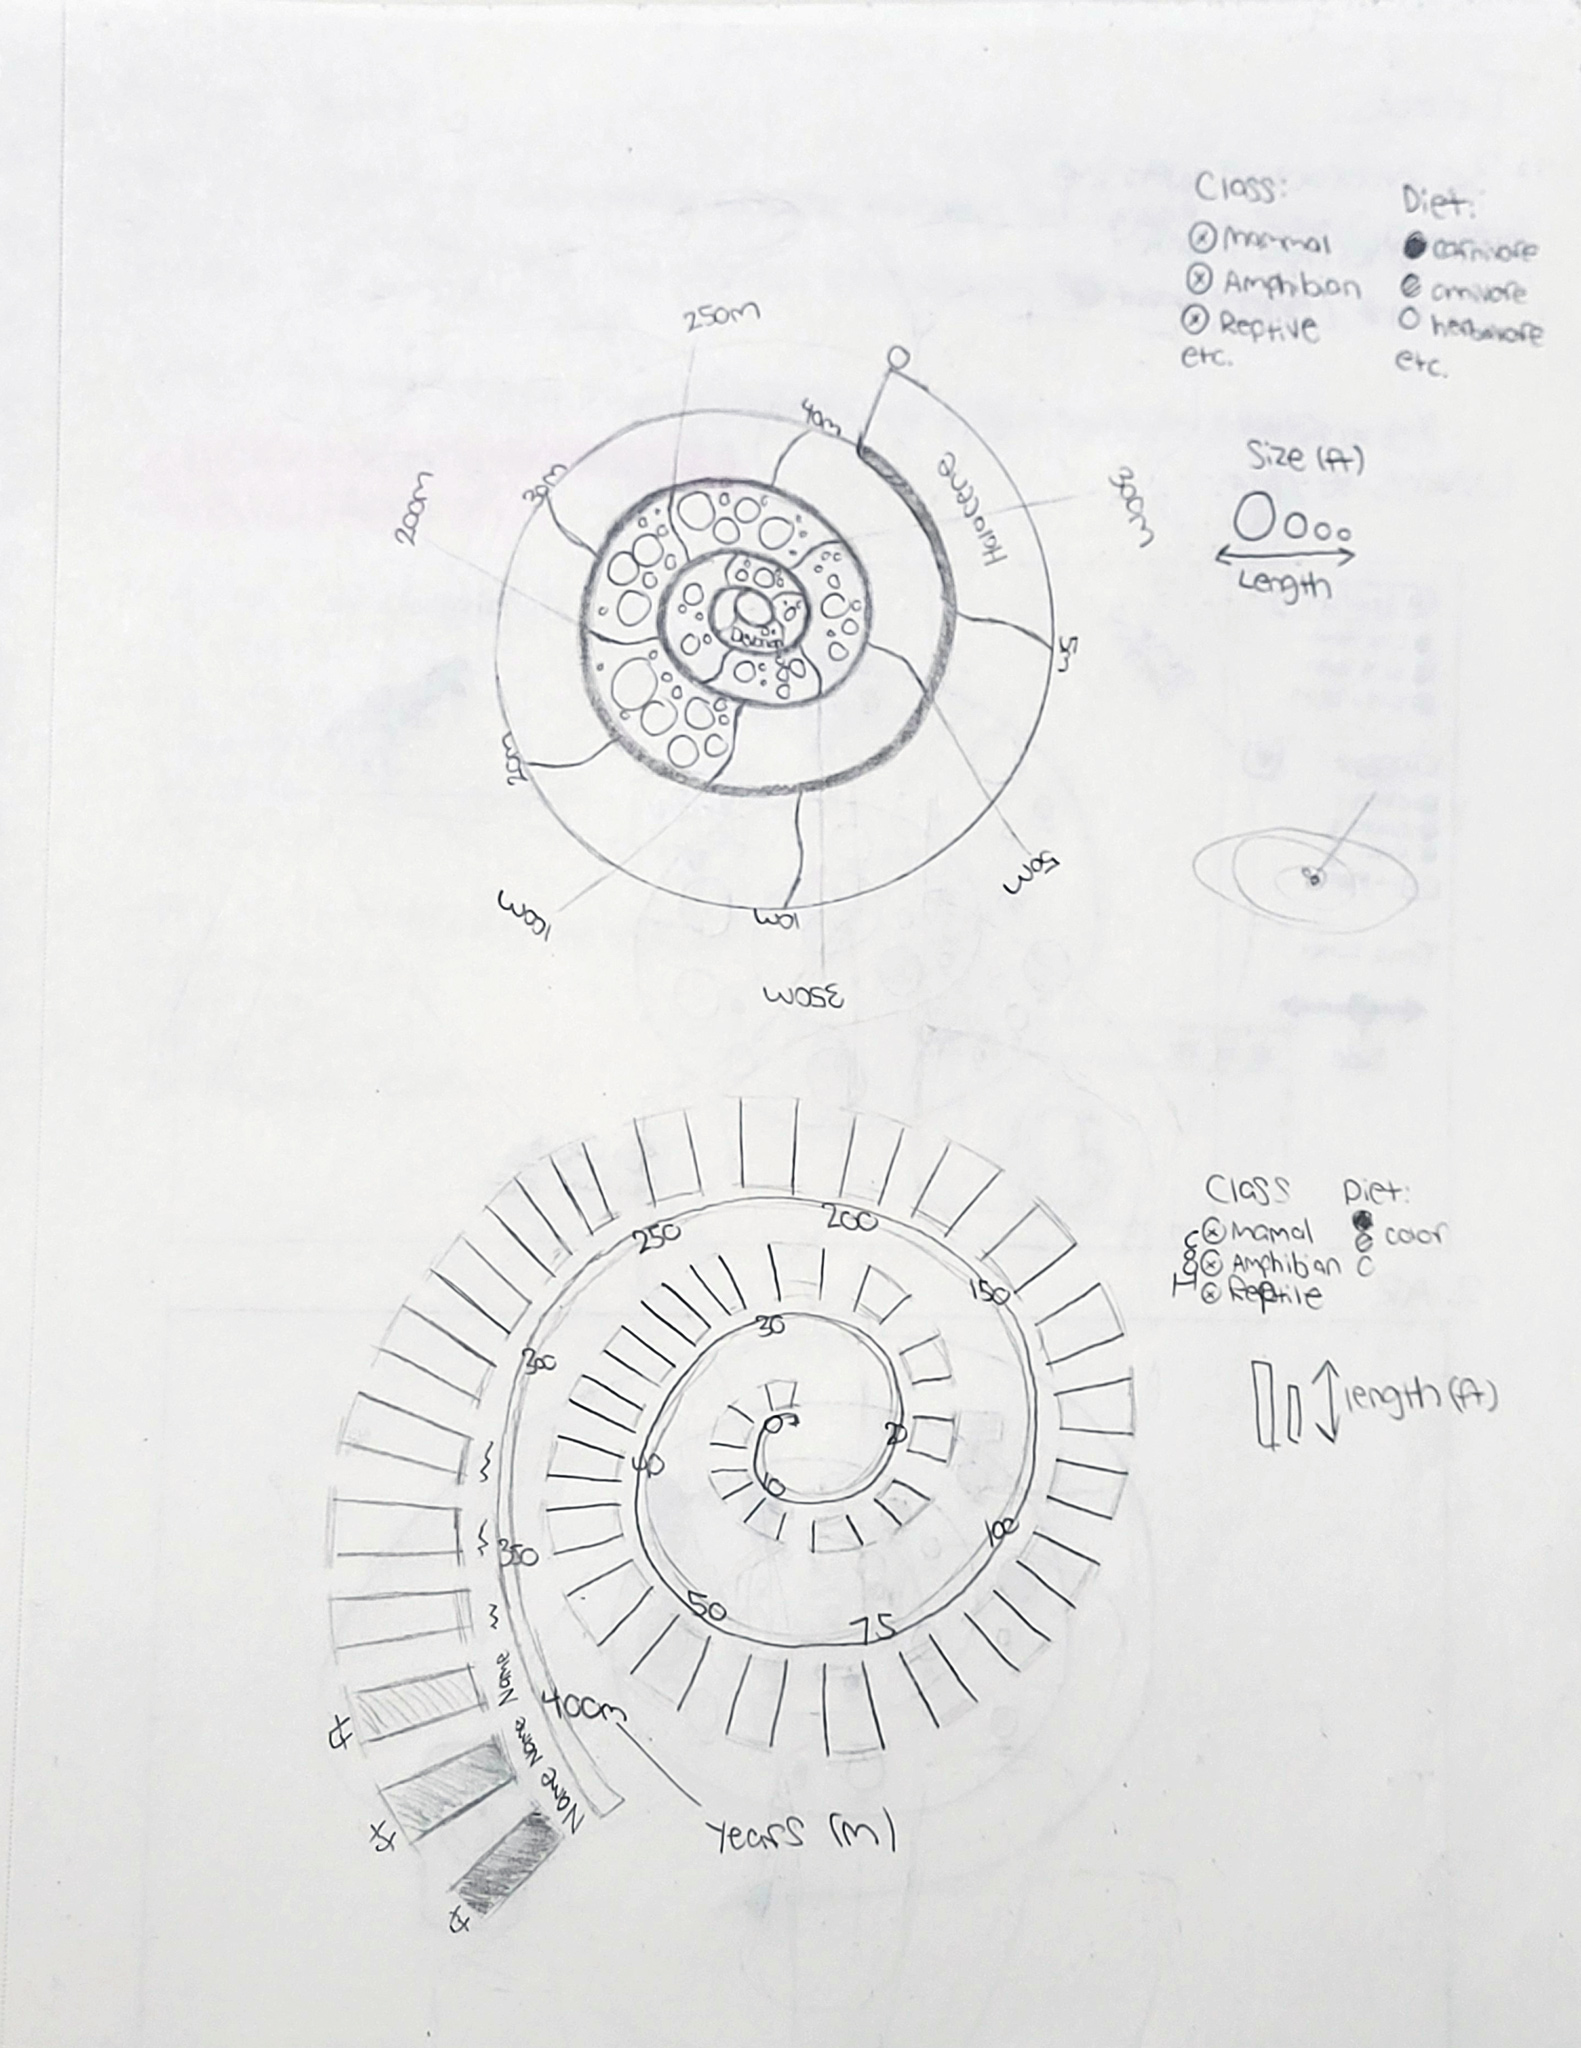
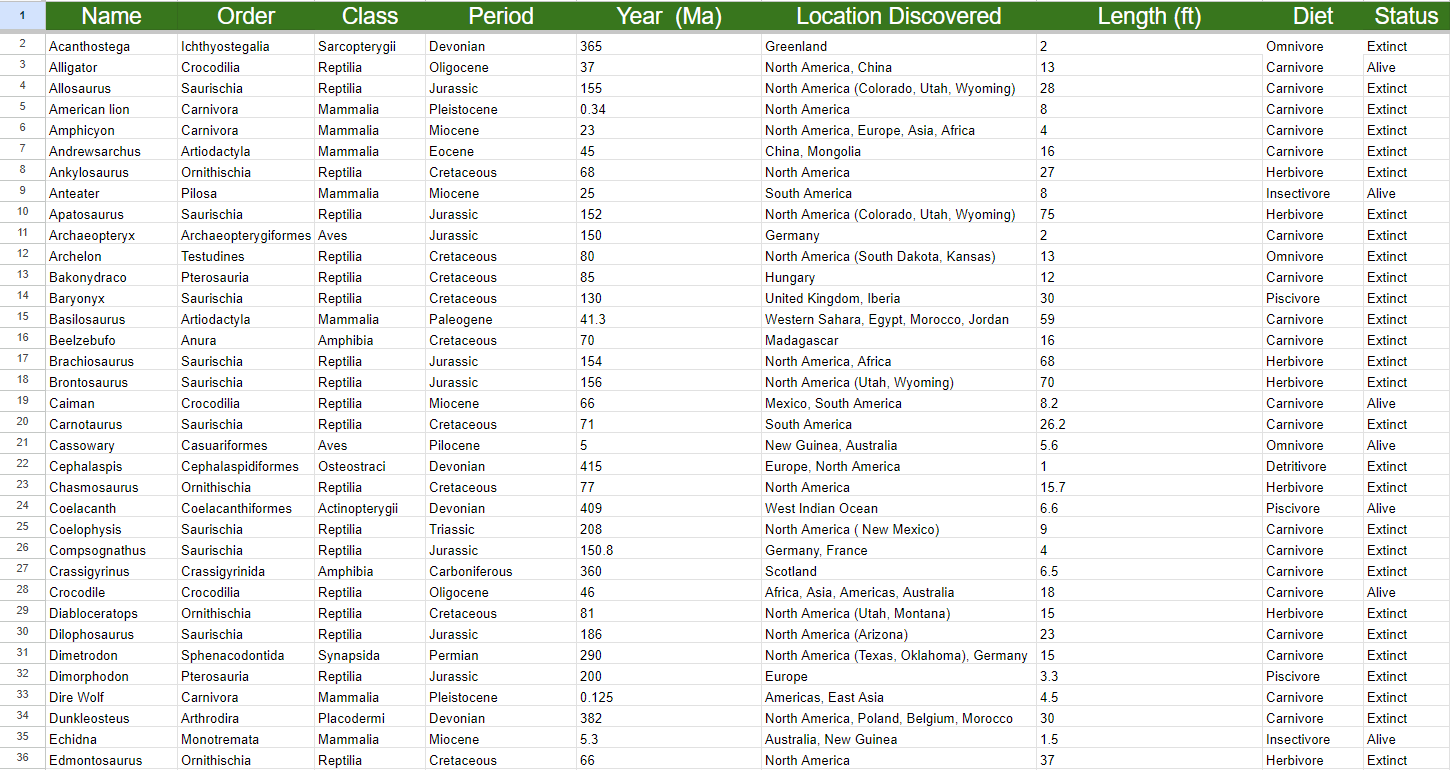
After sketching my ideas, I started researching prehistoric animals to find similarities and differences between each classification as the scientific process for classifying animals is quite technical. I found that each time period had a dominant animal class that continued to evolve over time which in turn created a new class of animals. The categories I used for classifying these animals includes length, class, diet, and time period.
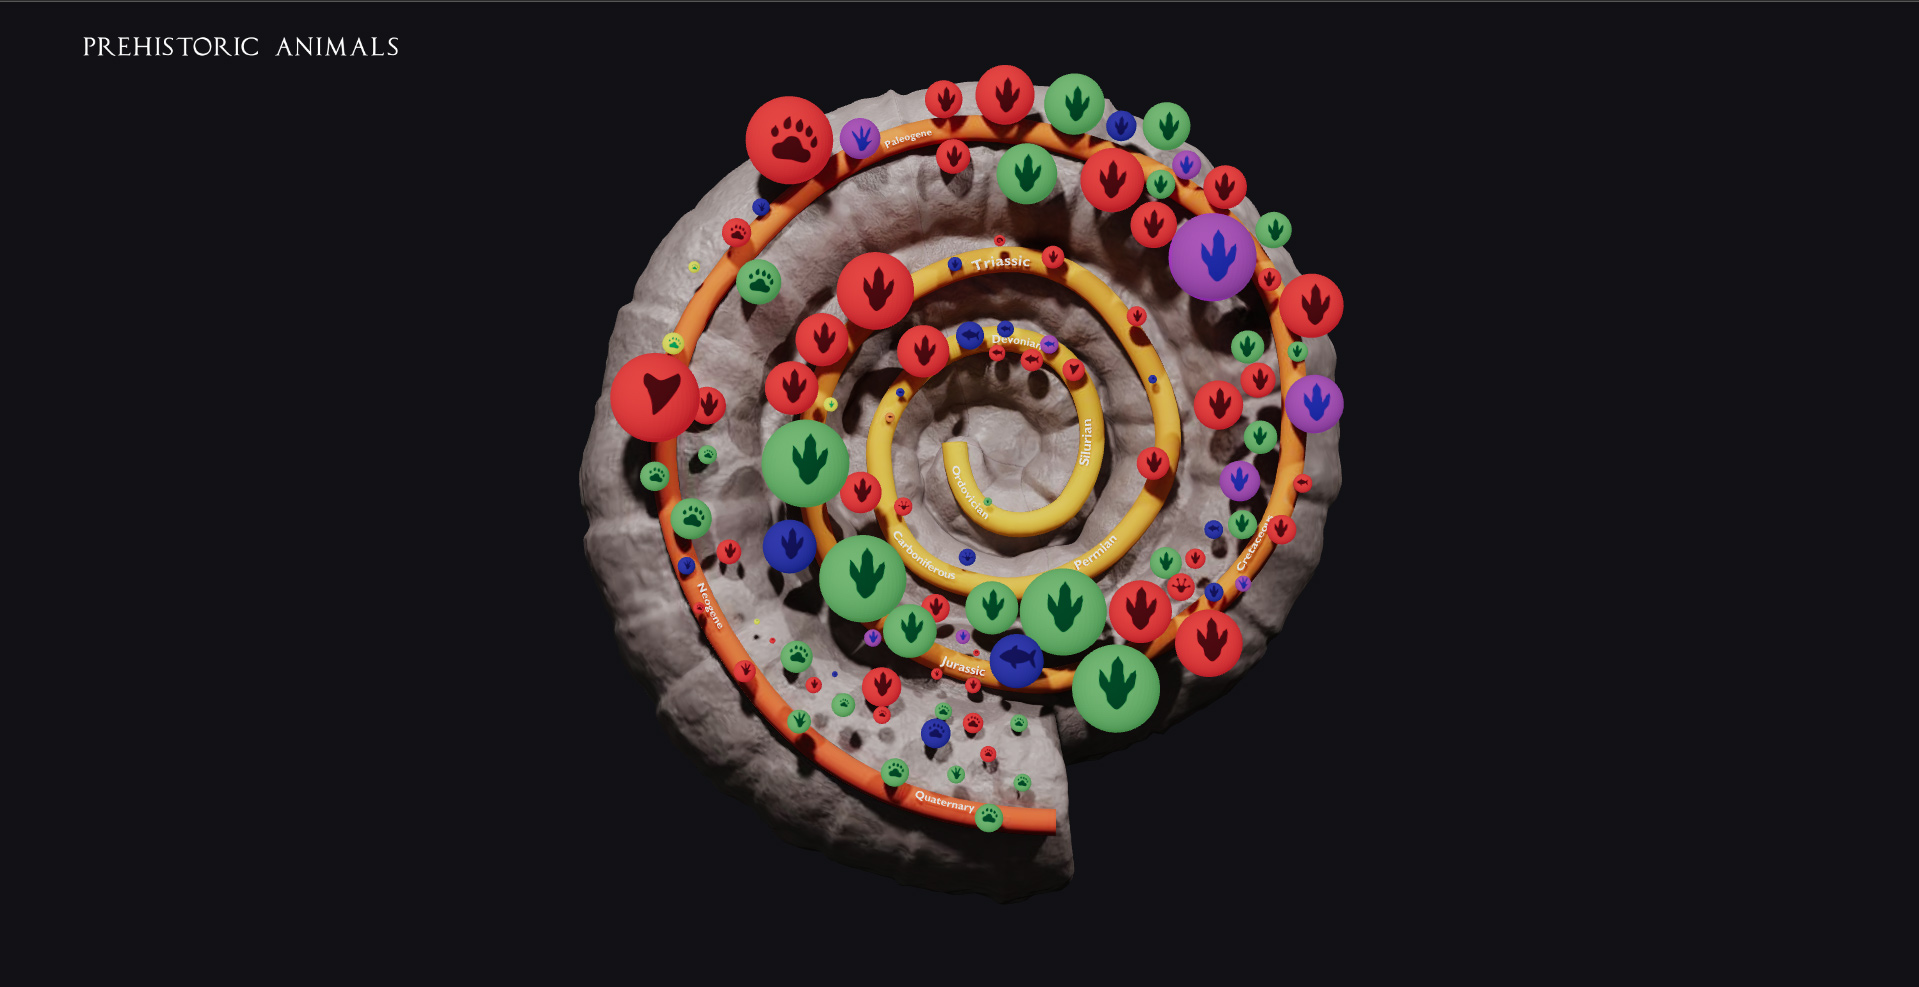
For the design, I created a 3d model of an ammonite fossil, a common ocean dwelling cephalopod that existed 66 million years ago. The shell of the ammonite has a spiral shape that recedes inwards while also having defined grooves that create various sections on the surface. I utilized this spiral shape as a time line and allowed for the grooves of the shell to divide each part of the line into sections. The data points where then added as spheres and varied in size and color.
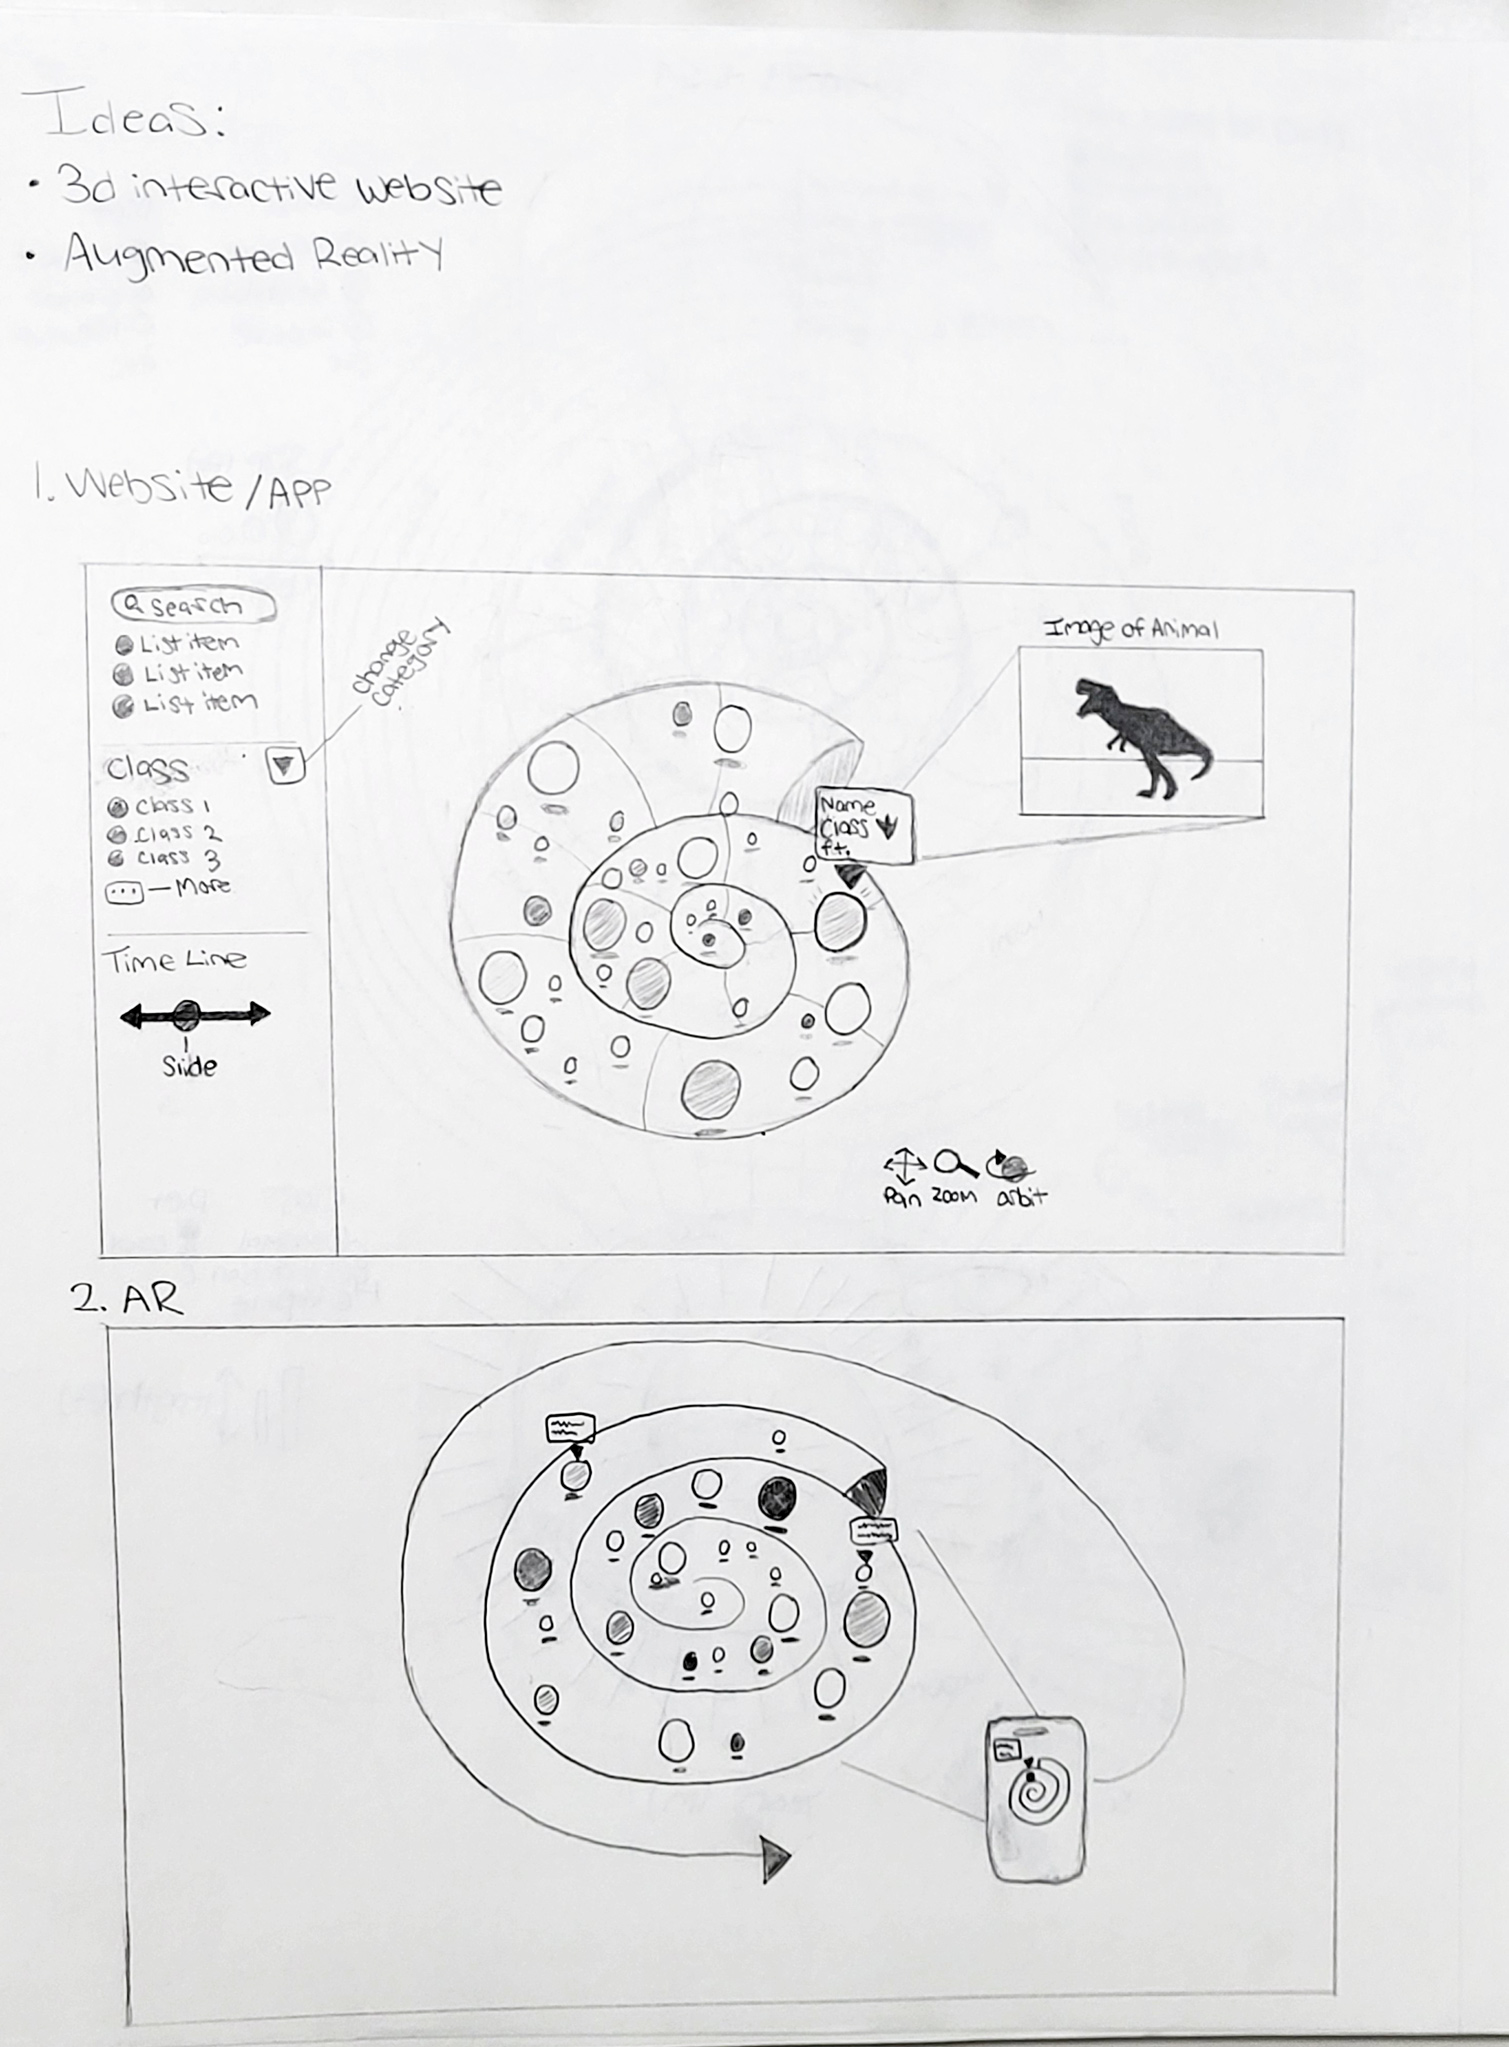
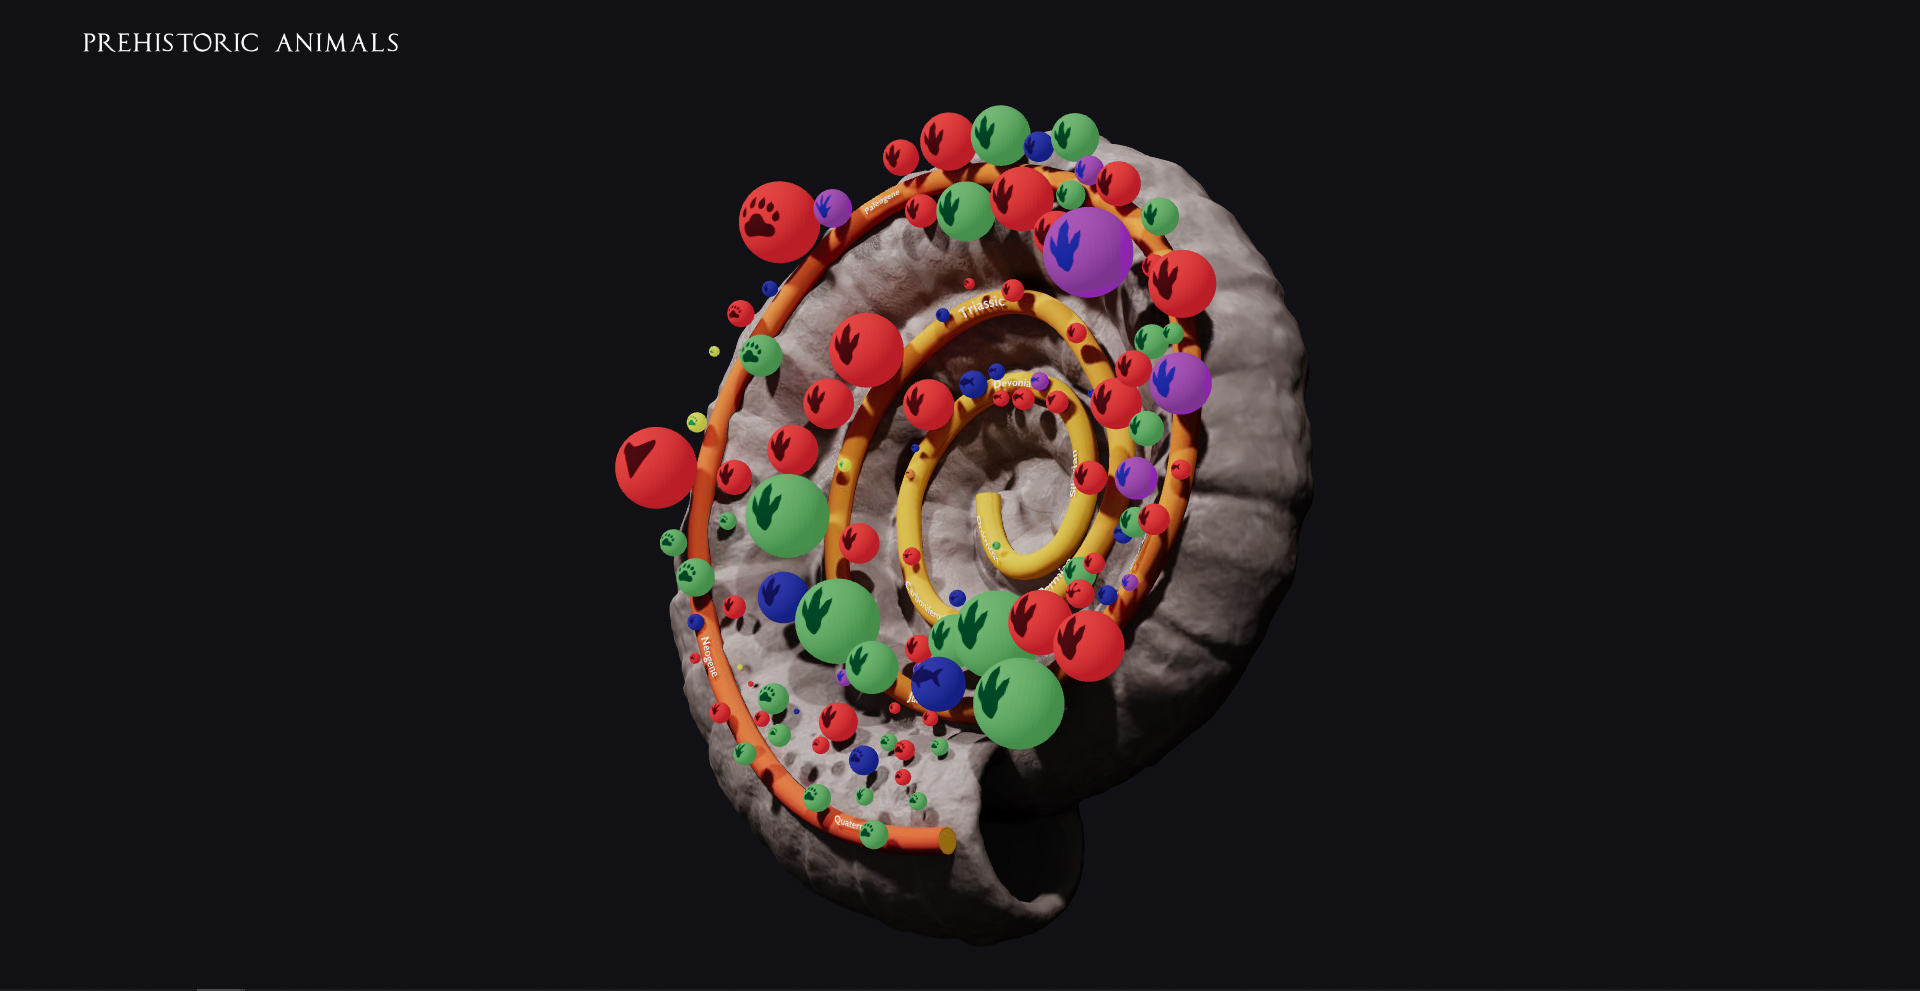
After designing a complete visualization for my data points, I continued to expand upon this project by creating an interactive 3d website using React Three Fiber, a web renderer that utilizes the Three.js script library for React applications. Three.js uses a canvas and WebGL to display 3d models and animations on the web. I made each data point in the design interactive, allowing users to find more information about each item. The site features an immersive 3d experience that allows users to interact with the model.
Product Page
Web, 3D
Stationary Design
Branding
Visual Design
Print